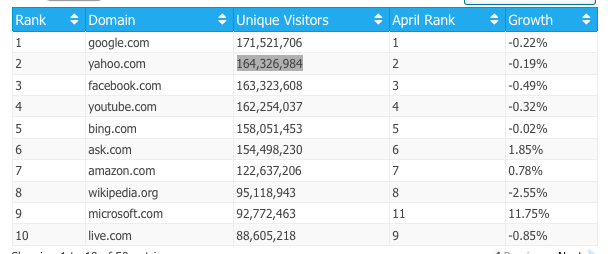
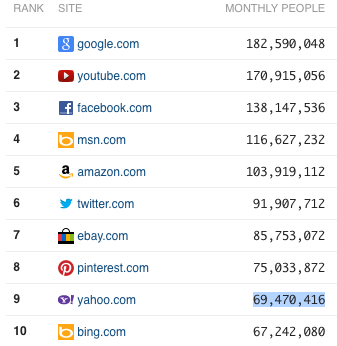
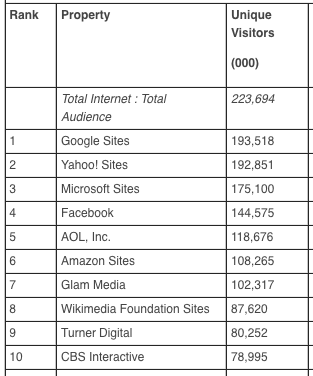
At least Comscore rounds to the nearest thousand, and their listing says “Yahoo! Sites” so they may be including Flickr.com as well. Leaving aside Comscore, which may not be measuring the same thing, the other numbers (both for yahoo.com) differ by a factor of almost 2.4. They can’t both be right. Even if you round to the nearest hundred million, they are still different. Alexa.com, incidentally, currently lists Yahoo! in fourth place, but does not give absolute numbers for visitors, merely a “Percentage Reach” figure to two significant figures. Thank you Alexa for not claiming more accuracy than your measurement techniques can possibly justify.
We see the same thing in statistics relating to spam. Every so often one or another messaging security company will announce that 92.76% of all email is spam (down 1.37% from last month) or that the largest source of spam in the world is now Roubaix, France, and that is reported in the press as gospel truth. I’ll take a look at our statistics and quite often see something completely different. Why is that? I think there are two main reasons. The first is that different companies have different client bases, introducing sample bias. The second is that many large organizations have more than one spam filtering process in place, so the quantity and quality of spam seen by a particular filter depends on where it is in the chain of filters for that installation. Cloudmark receives spam reports from a wide variety of sources, including our Cloudmark Security Platform clients in sixty four countries and from Cloudmark Desktop users world wide. We believe we have a clearer and more complete picture of world spam than any other company, but there may still be sample bias in our data, and we are certain that there is sample bias in companies who do not have as great a global reach. Most major ISPs use more than one type of spam filtering. IP address blacklisting is a simple and fast method of spam filtering. It does not stop all spam, but it is a good first line of defense. With Cloudmark Security Platform for Email or similar mail server software, blacklisted IP addresses are not even allowed to connect to the mail server. In that case, there is no way of saying how many spam messages are being blocked, nor how many recipients those messages would have been sent to, because the messages themselves, do not make is as far as the mail server, let alone the user's spam folder. Incidentally, that's one reason why Cloudmark's quarterly messaging threat reports discuss the number and percentage of blacklisted IP addresses by country as a measure of the spam threats from that country, rather than trying to measure spam volumes. After the IP address blocking the next step is policy based filtering. This may impose rate limits on IP address blocks, or other filtering or flagging based on the email's metadata. As IPv6 rolls out, and the IP address space is vastly expanded, policy based filtering and rate limiting will become far more important, as traditional IP blacklisting, even at the network level, will be exponentially more difficult. However, each ISP may set different policy rules. A burst of email that may sail through one one provider's filters may be slowed to a crawl or stopped entirely by another. While it's possible to collect statistics from policy filtering, statistics from different ISPs will not be directly comparable. The last line of defense is content based filtering. This takes what is left after IP blacklists and policy have been applied, and decides if it goes in the inbox or the spam folder. This is the spam that is the most difficult to filter, as the more sophisticated spammers are continually changing their message content and calls to action, so that any fingerprinting system must respond equally quickly to keep up with them. This is cyber guerrilla warfare and it is vicious and incessant. The fact that you hardly ever see spam in your in box is not because we have won the war on spam, it is because we keep winning all the battles. It's this final stage of filtering that many of the statistics quoted in this blog come from. It's the news from the last line of defense against the spammers - an automated system that can respond to new threats within seconds backed by 7/24 human monitoring from our Security Operations Center and Accuracy Engineers. If our statistics are different from other companies' statistics, I think it's because we are focusing on the most serious threats. UPDATE August 12, 2013: Kudos to UPI for reporting on a finding from Kaspersky Lab's spam statistics, and pointing out that Spamhaus gets a completely different result.Mobile Messaging Security
Protect mobile messaging from evolving threats with leading, real-time, automated, and predictive mobile security products.
Email Messaging Security
Protect email messaging from evolving threats with the leader in real-time, automated, and predictive email security products.
Threat Insight
Enable security services with threat intelligence and data from the Cloudmark Global Threat Network.
The most complete, comprehensive and accurate Mobile Messaging defense solution
Industry leading predictive, machine learning technology combined with the world's largest mobile messaging threat analysis system.
Learn MoreMobile Operators
Secure Your Mobile Messaging Environment
Cloudmark mobile solutions deliver the fastest and most accurate response to protect your mobile network.
Protect Your Traffic with a Cloud Service
Utilize a cloud-based, fully managed security service to protect your network and subscribers from phishing/smishing, spam, and viruses.
Monetize Traffic by Identifying and Preventing Grey Route Abuse
Protect and increase revenues by monetizing "grey route" traffic and application to person (A2P) messaging.
Secure Your RCS and Future Mobile Messaging Traffic
Protect mobile-based Rich Communications Services (RCS) and revenues against phishing/smishing, spam, and viruses.
Secure Your Email to Mobile Messaging
Enable industry's best protection for email to mobile messaging services.
Internet Service Providers (ISPs)
Secure Your Email Environment On-Premises
Utilize the most comprehensive suite of tools and capabilities leveraging the Cloudmark Global Threat Network to protect your customers.
Secure Your Email Environment Cloud Version
Utilize a cloud-based service, best-in-class Cloudmark Global Threat Network, and fully managed SOC to protect your customers from spam, phishing, and viruses.
Provide Real-time (best-in-class) Threat Insight through Scanning and Analysis
Utilize automated, machine learning and the best-in-class Cloudmark Global Threat Network to accurately rate senders and content.
Provide a Better Email Experience to Your Customers
Delight your customers by providing a high-performance, sorted mailbox experience.


